

Writing
Add diagrams, charts and code
Add code with syntax highlighting, draw flowcharts from Mermaid code, and build charts from a few lines of JSON.
Type /code, /diagram or /chart to add one of these blocks. Diagrams and charts are drawn from a few lines of code that stay in your paper, so you can change them any time.
Add a code block
- Type /code and choose Code block. You can also type three backticks at the start of a line.
- Pick the language from the Code language menu at the top of the block.
- Type or paste your code.
The code is shown in a monospaced font with colours for its language. You can choose from Plain text, Bash, C, C++, C#, CSS, Dockerfile, Go, HTML, Java, JavaScript, JSON, Markdown, PHP, Python, R, Rust, SQL, TypeScript and YAML.
Draw a diagram
Diagrams are made with Mermaid, a simple way to describe flowcharts and other diagrams in text.
-
Type /diagram and choose Diagram. A small example flowchart appears.
-
Click Code at the top of the block to see and change the code. For example:
graph TDA[Research question] --> B[Find sources]B --> C[Write draft] -
Click Diagram to see the result.
If the code has a mistake, the block says “Check the Mermaid syntax in the Code view.”
Make a chart
Charts are described in JSON, using the same settings as the Chart.js library. It’s quicker to make a chart from a table if you don’t want to write code.
-
Type /chart and choose Chart. A sample bar chart appears.
-
Click Code to edit it. A chart needs a
type(likebar,lineorpie) and somedata:{"type": "bar","data": {"labels": ["2022", "2023", "2024"],"datasets": [{ "label": "Responses", "data": [40, 65, 82] }]}} -
Click Chart to see the result.
If something is wrong, you’ll see “This is not valid JSON.” or “A chart needs at least “type” and “data”.”
Add a caption and alt text
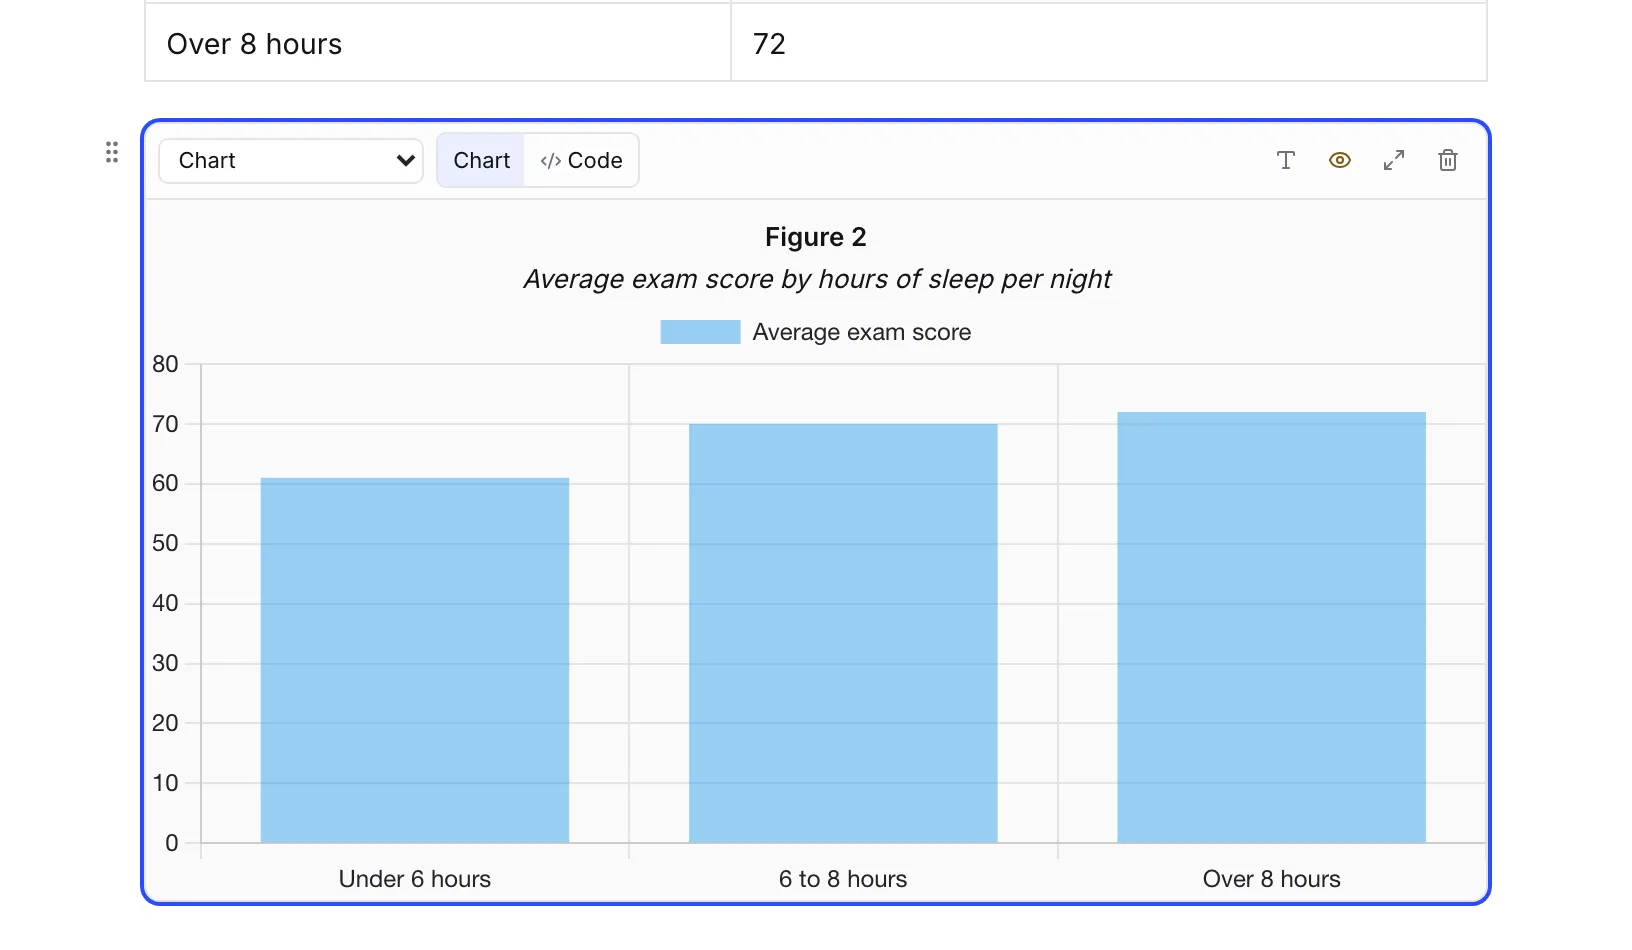
Diagrams and charts are figures, so they can have a numbered caption like “Figure 2”. Use the buttons at the top of the block:
- Caption adds a caption. See Number figures and refer to them.
- Alt text describes the diagram or chart for people who use screen readers. The button stays amber until you add some.
- Expand shows the diagram or chart larger.
- Delete block removes it.
To save a diagram as an image file, click Download SVG on the diagram.
Diagrams and charts in your exports
Every export draws diagrams and charts as pictures, so they look the same in Word, PDF, LaTeX and web pages. If one can’t be drawn, the file shows its code instead, and the Export dialog says so. See Export your paper.
Frequently asked questions
Do diagrams and charts count toward my word count?
No. The word count ignores the code behind diagrams and charts, and code blocks are left out of the count in Check my paper.
How do diagrams and charts look in Word or PDF?
They are drawn as pictures in every export, so they look the same in Word, PDF, LaTeX and web pages. If one can't be drawn because its code has a mistake, the file shows its code instead, and the Export dialog tells you.
Is there an easier way to make a chart from my data?
Yes. Put your numbers in a table, then use Make a chart in the table's Block actions menu to draw a bar, line or pie chart without writing any code.
Was this page helpful?
Thanks for letting us know.